Calculating the sound absorption of perforated plywood
The sound absorption we show for perforated plywood is calculated, not measured on our own board. Here is how the calculation is made and how it is calibrated against publicly available measurements, so an acoustician can check it.
- Basis
- Calculated, not measured on our panel
- Calibration
- 54 publicly available measurements
- Models
- Maa for the holes, Miki for the mineral wool
- Accuracy
- αw on average 0.08 off
- Standard
- αp and αw under EN ISO 11654
- The room
- Sabine's formula against the BR18 requirements
The sound absorption we show for acoustic walls in perforated plywood is based on a model we have calibrated against publicly available measurements of perforated panels from manufacturers' data sheets and a diploma thesis. This page explains how the sound absorption is calculated, which measurements it is calibrated against, and how well it performs.
These are the same figures shown on the page about acoustic walls in perforated plywood and in the acoustic designer (in Danish).
The panel and the holes
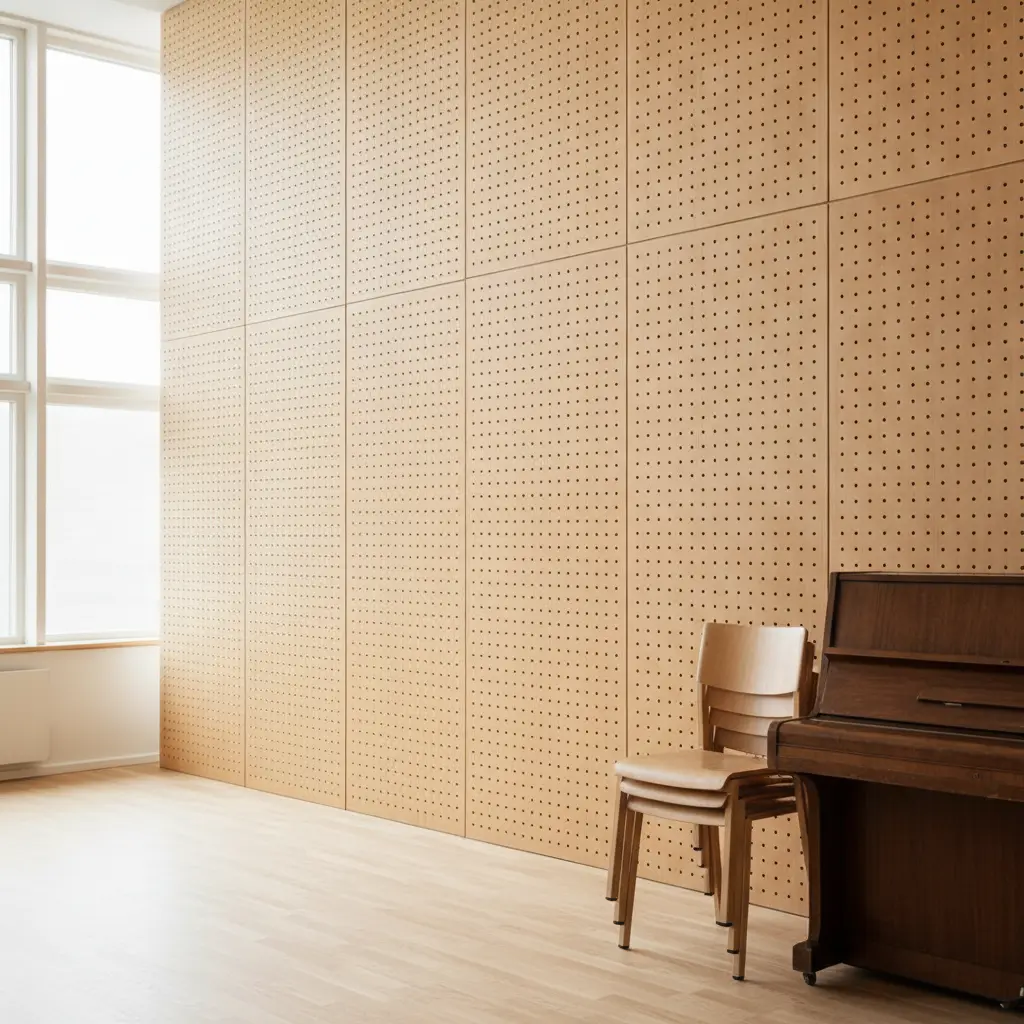
The panel is 12 mm plywood with round holes that go straight through without counterboring. The holes are calculated with Maa's model as short tubes: the air in each hole has a mass, and friction against the wall of the hole gives a resistance. Both depend on the hole diameter d, the panel thickness t, the open area ε and the frequency. At the ends of the hole a little extra air moves along, and it is calculated as an end correction of δ · d · F(ε), where F(ε) = 1 − 1.47 · √ε + 0.47 · ε^1.5 accounts for the neighbouring holes influencing each other. Maa uses δ = 0.85, and the calibration has set δ to 1.49. The panel is treated as rigid, so the wood species is not part of the calculation, only the thickness, the holes and the open area.
The open area is the part of the panel that is holes. In a square hole grid it is π · d² / (4 · c²), where c is the centre-to-centre distance. The Standard pattern has holes of 0.8 cm at 1.6 cm centres, which makes the grid 19.6 % open. The panels are 60 cm wide and 240 cm high with a 2 cm border without holes, and across the whole panel the open area is 18.1 %. That is the figure the calculation uses. In the Dense pattern the holes sit in staggered rows with a row spacing of c · √3 / 2, so the distance to all neighbours is the same.
The cavity and the mineral wool
Behind the panel is a cavity against a rigid wall. The mineral wool is calculated with Miki's model from the airflow resistivity σ of the wool, and the rest of the cavity is air. The panel, the wool and the air are calculated as layers one after another, which gives the impedance of the surface.
We do not know the wool in the individual project, so σ is assumed: about 15 kPa·s/m² for mineral wool of about 30 kg/m³. If the acoustician's report or the wool's data sheet states a different wool, that is what applies.
When the wool lies against the back of the panel, the air from the holes is pushed out into the wool. This adds a resistance of σ · k · d / ε, where the calibration has set k to 0.51. All our figures are calculated with the wool against the panel, either in a 4.5 cm cavity filled with mineral wool or in a 9.5 cm cavity with 5 cm mineral wool against the panel and 4.5 cm air behind. 53 of the 54 measurements the model is calibrated against are also calculated with the wool against the panel, but for 30 of them the data sheet does not say where the wool lies.
The cavity is calculated as extended-reacting. Sound also travels obliquely through the air and the wool behind the panel, as in a cavity without partitions. The calibration chose this over a locally reacting cavity because it performed better on measurements the model had not seen: the mean error per octave band was 0.117 versus 0.126.
From impedance to αp and αw
In a reverberation room, sound arrives from all directions. We calculate the absorption for 90 angles of incidence from 0 to 90 degrees and combine them using Paris' formula for a diffuse field. Under ISO 354 a sample of 10 to 12 m² is measured, and a sample of that size absorbs more sound than an infinite surface, especially below about 1000 Hz, because sound bends around the edges of the sample. We therefore calculate with a blend of the infinite surface and Thomasson's radiation impedance for a 3.0 by 3.6 m sample, and the calibration has set the sample's share to 0.49. That makes the figures comparable with measurements in reverberation rooms, and α can exceed 1 in a third-octave band, as in a measurement.
At 2000 to 4000 Hz the manufacturers' measurements lie 0.1 to 0.4 above the pure physics, more the larger the open area. We cover this with an addition that has no physical model behind it and is only calibrated: α' = 1 − (1 − α) · (1 − g), where g = 0.57 · min(1, ε / 0.28) · h(f). h(f) is 0 up to 500 Hz and 1 from 2000 Hz and rises linearly in log f in between.
The calculation gives α in third-octave bands from 100 to 5000 Hz. Under EN ISO 11654 the practical sound absorption coefficient αp in an octave band is the mean of the three third-octave bands, rounded to 0.05 and at most 1.00. The weighted sound absorption coefficient αw is found by shifting the reference curve, which is 0.80 at 250 Hz, 1.00 from 500 to 2000 Hz and 0.90 at 4000 Hz, downwards in steps of 0.05 until the sum of the unfavourable deviations is at most 0.10. αw is the value of the curve at 500 Hz. The absorption class follows from αw: A from 0.90, B from 0.80, C from 0.60, D from 0.30 and E from 0.15.
With the Standard pattern and 4.5 cm mineral wool, αp is 0.60, 0.95, 0.90, 0.70 and 0.55 from 250 to 4000 Hz. Shifted by 0.25, the curve lies 0.05 above αp at 2000 Hz and 0.10 above at 4000 Hz, 0.15 in total. Shifted by 0.30, the sum is 0.05, so αw is 0.70 and the absorption class C. At 500 Hz αp lies 0.25 above the shifted curve, so the shape indicator is M. With a 9.5 cm cavity and 5 cm mineral wool this also applies at 250 Hz, which gives αw 0.70 (LM). 125 Hz is not part of αw, which is why we always show αp per octave alongside.
Calibration against 54 measurements
We have collected 62 publicly available measurements of perforated panels, 61 from five manufacturers' data sheets and one from a diploma thesis. Eight are left out because the holes were drilled larger from the back, or because the front had grooves with holes from behind. Those are not holes like ours. The 54 we use are 53 panels from the manufacturers and a fibre cement panel from the diploma thesis, all with through holes. The model assumes the figures were measured in a reverberation room under ISO 354, but we have not been able to verify this for every measurement. For one manufacturer the data sheet's graph calls the curve predicted. That is probably a typo for practical, but we do not know for certain that the curve was measured.
The measurements cover open areas from 1.9 to 39 %, holes from 0.5 to 1.2 cm, cavities from 2.5 to 35 cm and panels from 10 to 16 mm. 53 are calculated with mineral wool against the panel, and one has polyester felt against the wall with air in between. According to the data sheet, 31 have a fleece on the back of the panel and are calculated with it. 22 are figures from tables, and 32 are read off graphs or have a less clear method. The data sheets rarely state the full build-up, and where they do not, we have assumed it: the panel thickness for 29 of the measurements, where the wool lies for 30, the cavity depth for 13 and the hole pattern for 12. For 7 the data sheet does not say what lies behind the panel, and we have calculated with mineral wool as in another manufacturer's equivalent build-up. The 22 where the data sheet does not say whether there is a fleece are calculated without. The airflow resistivity σ is assumed from the type of wool and, where stated, its density. Only for the felt in the diploma thesis is it measured.
The calibration adjusts six quantities in the model so the error against the measurements is minimised, and the airflow resistivity σ is held fixed. Figures from tables weigh 1.0 and the others 0.6. The source with the most measurements weighs half, so it does not drive the calibration on its own, and measurements from the same source that the model calculates with exactly the same build-up share the weight.
| Quantity | What it does | Value |
|---|---|---|
| End correction δ | The air moving along at the ends of the holes | 1.49 (Maa: 0.85) |
| Wool against the panel, k | Extra resistance σ · k · d / ε | 0.51 |
| Sample size | Share of the difference between an infinite surface and a 10.8 m² sample | 0.49 |
| High-frequency addition | Largest addition at 2000 to 4000 Hz | 0.57 |
| Limit of the addition | The addition is full from this open area | 28 % |
| Fleece on the back | The fleece's resistance R, in the holes R / ε | 26 Pa·s/m |
| The cavity | Locally or extended-reacting | Extended |
The fleece is included because many of the measurements have one. Our own figures are calculated without fleece. Without calibration, the pure physics came out on average 0.22 too low for αw across the 54 measurements.
How well the calculation performs
To see how well the model predicts measurements it has not seen, we calibrated it six times, each time without one source's measurements, and calculated the left-out ones with it. That way αw was on average 0.08 off, and four times out of five within 0.15. On average the calculation was 0.025 below the measurements. For the source the model predicted worst, αw was on average 0.15 below the measurements, and for another 0.12 above.
| Octave band | Mean error | Four out of five within |
|---|---|---|
| 125 Hz | 0.12 | 0.21 |
| 250 Hz | 0.19 | 0.30 |
| 500 Hz | 0.12 | 0.20 |
| 1000 Hz | 0.10 | 0.17 |
| 2000 Hz | 0.08 | 0.15 |
| 4000 Hz | 0.09 | 0.16 |
| αw | 0.08 | 0.15 |
The error is the difference between calculated and measured α, both capped at 1. The right-hand column is the uncertainty we work with: four out of five of the left-out measurements lay within it.
Where the calculation performs worst
The bass is hardest, and the error is largest at 250 Hz. Below 5 % open area (13 measurements) the air in the holes becomes heavy, and the model's physics is weakest. Here the calculation was on average 0.20 off at 125 Hz and 0.22 at 250 Hz, against 0.12 and 0.19 for all measurements. The Sparse hole pattern has 4.7 % open area and falls in that range.
With 2 to 10 cm of air between the wool and the wall (8 measurements), the calculation was on average 0.18 off at 125 Hz and 0.13 at 2000 Hz, against 0.12 and 0.08 for all. The build-up with a 9.5 cm cavity and 5 cm mineral wool has 4.5 cm of air and belongs here. Where the wool fills the cavity with at most 2 cm of air, as in the 4.5 cm build-up (25 measurements), αw was on average 0.09 off.
Above 25 % open area (8 measurements), αw was on average 0.13 off and 500 Hz 0.23. Our four hole patterns have between 4.7 and 20.7 % open area. Below 1.9 % and above 39 % open area we are outside what the measurements cover, and the designer says so when a custom hole pattern goes that far. The model is not calibrated against any measurement with an empty cavity, so we do not calculate it.
Reverberation time in the room
In the designer's Room step we calculate the reverberation time with Sabine's formula, T = 0.161 · V / A, for each octave band from 125 to 4000 Hz. V is the room volume in m³, and A is the room's absorption in m², the sum of each surface's area times its α. The acoustic wall replaces a section of wall, so with panels A = A without + S · (αp − α of the wall), where S is the panel area.
The room's surfaces are calculated with typical table values from a public materials database compiled from measurements under ISO 354. The furniture is treated as part of the floor with a share we have assumed: wooden tables and chairs on a quarter of the floor in a classroom and a fifth in a daycare centre, and desks with upholstered chairs on a sixth in an office. The room is calculated furnished and unoccupied, as the requirement applies. The ceiling is the choice that moves the most.
| Surface | 125 Hz | 250 Hz | 500 Hz | 1000 Hz | 2000 Hz | 4000 Hz |
|---|---|---|---|---|---|---|
| Light plasterboard walls with windows and doors | 0.15 | 0.10 | 0.06 | 0.04 | 0.04 | 0.05 |
| Linoleum on concrete | 0.02 | 0.03 | 0.03 | 0.03 | 0.03 | 0.02 |
| Wooden tables and chairs | 0.05 | 0.08 | 0.10 | 0.12 | 0.12 | 0.12 |
| Hard ceiling of concrete or plaster | 0.01 | 0.01 | 0.02 | 0.02 | 0.02 | 0.05 |
| Perforated plasterboard ceiling | 0.45 | 0.55 | 0.60 | 0.90 | 0.86 | 0.75 |
| Mineral wool acoustic ceiling | 0.48 | 0.97 | 1.00 | 0.97 | 1.00 | 1.00 |
| Acoustic wall, Standard, 4.5 cm mineral wool | 0.25 | 0.60 | 0.95 | 0.90 | 0.70 | 0.55 |
One example is a classroom of 9 by 7 metres with 3 metres to the ceiling, 189 m³, with a perforated plasterboard ceiling. At 250 Hz, A = 96 · 0.10 + 63 · 0.03 + 63 · 0.55 + 15.75 · 0.08 = 47.4 m² for walls, floor, ceiling and furniture, and T = 0.161 · 189 / 47.4 = 0.64 s. With 7.2 m² of panels, A = 47.4 + 7.2 · (0.60 − 0.10) = 51.0 m², and T = 0.60 s. The panel area needed in each octave band is S = (0.161 · V / requirement − A without) / (αp − α of the wall), and the largest of them applies. Here it is 6.6 m² at 250 Hz. With a hard ceiling about 250 m² would be needed at 125 Hz, which is more than the room's four walls of 96 m².
We calculate without the air's own absorption and with Sabine rather than Eyring. Both give a slightly too long reverberation time in rooms with a lot of absorption, so the calculation errs on the safe side and gives more panels, never fewer.
The requirements are in the guidance on acoustic conditions to the Danish Building Regulations, BR18. In classrooms the maximum is 0.6 seconds and in common rooms for group work 0.4 seconds (educational buildings, table 3.4), and in playrooms in daycare centres 0.4 seconds (table 4.4), in every octave band from 125 to 4000 Hz. At 125 Hz the value may be 20 % higher, and the requirements apply in furnished rooms. Sports halls must have at most 1.6 seconds below 3500 m³ and 1.8 seconds above, calculated unfurnished. For offices and meeting rooms, 0.6 seconds is a suggested design value in the guidance for office buildings, not a requirement. Outside Denmark, the national requirements apply, and the acoustician sets the values.
What the figures are not
The figures are a calculation. They are not a test report, and they are not a guarantee of the sound absorption or the reverberation time in a project. None of the measurements are of our own panel, and only a measurement of it can show how well the figures match that panel. The actual reverberation time depends on the room's actual surfaces, windows, doors and furniture, on the cavity and the wool behind the panels and on where the panels are placed.
Use the figures to choose a hole pattern and build-up, and to see whether wall panels alone can meet the requirement. The acoustician calculates the real room and sets the project's values, and the reverberation time is measured in the finished room. Send us the acoustician's report together with the drawings, and we will match the hole pattern and build-up to it.